
Dynamic Mechanical Analysis shows how a material’s structure responds to frequency, temperature, and load. This application note measures how test frequency shifts the glass transition temperature (Tg) of an EPDM rubber.
- Tg of EPDM shifted from −36 °C at 1 Hz to −27 °C at 50 Hz
- tan δ magnitude also increased with increasing frequency
- Temperature ramps at three frequencies are fast and give more data points than a classic multi-stage frequency sweep
- All tests were run on the Alpha Metravib DMA+300 in compression mode
Why Frequency Matters
To understand the viscoelastic behavior of a material, Dynamic Mechanical Analysis (DMA) is one of the most useful characterization techniques. It helps in understanding the response of a material’s structure to different environmental conditions (for example, frequency, temperature, load, etc.), resulting in optimization of mechanical properties.
Among these conditions, this application note focuses on the effect of frequency on the glass transition temperature (Tg) of an EPDM material.
All tests presented in this study were performed using the Alpha Metravib DMA+300.
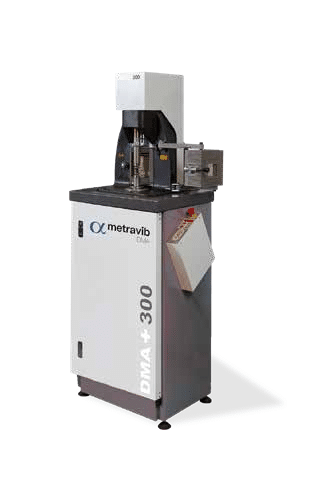
Figure 1. Alpha Metravib DMA
EPDM in Compression Across Three Frequencies
The material tested was EPDM (ethylene propylene diene monomer). EPDM is a durable synthetic rubber commonly used across many industries, such as tire manufacturing.
The specimens used were standard Goodrich cylindrical blocks with a diameter of 18 mm and a height of 25 mm. The specimens were studied in compression mode (see Figure 2). A dynamic force of 10 N was applied to the specimen, along with a static force of 20 N to ensure that the specimen remained in contact with the specimen holders.
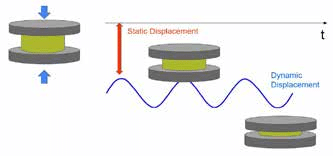
Figure 2. Compression mode
Since the objective was to demonstrate the effect of frequency on a material’s glass transition temperature, a temperature ramp from −60 °C to 100 °C was performed at three different frequencies: 1 Hz, 10 Hz, and 50 Hz. This test mode was selected because it is especially fast and provides more data points than a classic frequency sweep performed at multiple temperature stages. The test parameters are summarized in Table 1.
Table 1. Test parameters
| Parameter | Setting |
|---|---|
| Dynamic force | 10 N |
| Frequency | 1 Hz, 10 Hz, 50 Hz |
| Static force | –20 N |
| Temperature | −60 °C to 100 °C (60 min stabilization at −60 °C) |
| Rate | 2 °C/min |
| DMA | DMA+300 |
| Test mode | Compression |
Higher Frequency, Higher Tg
Figure 3 shows the results obtained from the temperature ramps performed at the three selected frequencies. The results are presented in terms of storage modulus (E′) and loss factor (tan δ) as a function of temperature. The decrease in E′ with increasing temperature indicates molecular dynamic rearrangements of elastomer chains between the glassy state (localized molecular movement) and the rubber-like state (high-amplitude movement) [1].
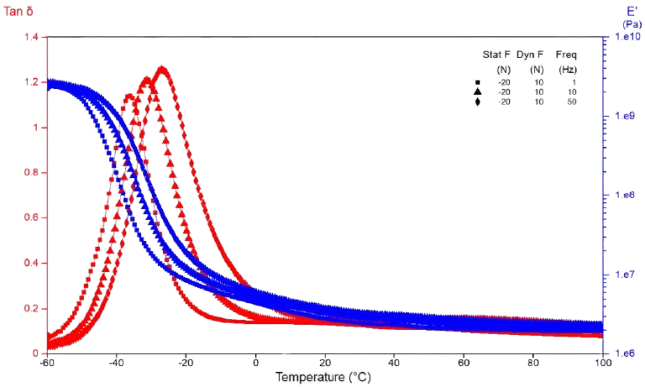
Figure 3. Storage modulus (E′) and tan δ of EPDM versus temperature at 1 Hz, 10 Hz and 50 Hz
Glass transition temperature of EPDM
Tested at 1 Hz
Tg
Tested at 50 Hz
Tg
Shift from 1 to 50 Hz
ΔTg
As shown in Figure 3, frequency has a clear effect on the glass transition temperature of the material. An increase in Tg with increasing frequency was observed, with Tg shifting from −36 °C to −27 °C as frequency increased from 1 Hz to 50 Hz.
An increase in tan δ magnitude with increasing frequency was also observed. At low frequencies, elastomer chains have more time to relax and respond, resulting in more viscous behavior and lower tan δ values. At higher frequencies, the chains have less time to relax and respond, leading to more elastic behavior and higher tan δ values.
What the Data Shows
This application note demonstrates the capability of the Metravib DMA+300 to characterize elastomer materials. Temperature ramps performed at different frequencies provided clear insight into the effect of frequency on the glass transition temperature of EPDM.
Additionally, the behavior of storage modulus (E′) and loss factor (tan δ) as a function of temperature was evaluated. Both glass transition temperature and tan δ magnitude were observed to increase with increasing frequency, which is correlated with differences in relaxation time available to the polymer chains.
The bottom line
DMA temperature ramps show that increasing test frequency shifts the glass transition temperature and viscoelastic response of elastomer materials.
Effect of Frequency on Viscoelastic Properties of Materials
Get the complete application note, including all figures and test details, as a PDF.
Introduction to Dynamic Mechanical Analysis for Rubber Materials
How rubber engineers evaluate real-world material behavior. Inside the guide: guidance for improving analysis quality and useful direction for integrating DMA into research, development, and testing workflows.
1. Kevin P. Menard. Dynamic Mechanical Analysis: A Practical Introduction.
ISO 6721, ASTM E1640