
The presence of long chain branching (LCB) in a polymer has a large impact on its viscoelastic properties and can significantly affect the processability of filled rubber compounds: black incorporation time, die swell, extrusion behavior.
- Long chain branching affects black incorporation time, die swell and extrusion behavior
- Linear viscoelastic characterization can’t disclose complex branching patterns; LAOS can
- Secondary loops in Lissajous figures appear only for fully linear polymers
- Two LCB indexes depend only on the degree of branching, insensitive to Mw and MWD
The presence of long chain branching (LCB) in a polymer has a large impact on its viscoelastic properties and can affect significantly the processability of filled rubber compound: black incorporation time, die swell, extrusion behavior. For instance, the incorporation of long chain branches has been used in EPDM and polyethylene (PE) to enhance shear thinning/flow behavior and, in the case of PEs, to delay the onset of melt fracture toward higher shear rates.
Although the influence of the molecular architecture of polymer on viscoelastic properties is usually investigated by the linear viscoelastic (LVE) characterization, this approach is not advanced enough to disclose information on complex branching patterns and for fully understanding the processing behavior of elastomers and thermoplastics materials.
FT-Rheology via Large Amplitude Oscillatory Shear (LAOS) is recognized as a very sensitive test method for detecting long chain branching (LCB) or more generally to distinguish different polymer topologies.
How To: Quantify Long Chain Branching
As already mentioned in the previous blog about this topic (read “FT-Rheology via LAOS Part 1 – Theory” here), the evolution in the shape of the distorted stress waveforms can be related with systematic changes in the internal microstructure of the material or the polymer topologies (linear or branched chain).
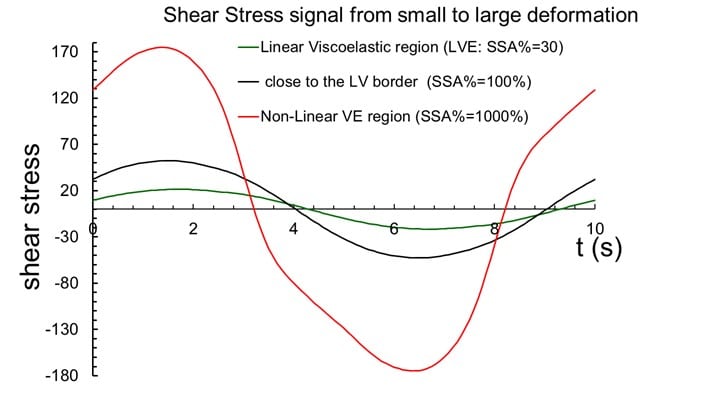
Figure 1. Distorted stress waveforms relate to changes in microstructure and polymer topology
LAOS responses can be visualized as parametric curves, called Lissajous-Bowditch figures of the oscillating shear stress, τ(t) vs. strain γ(t), or τ(t) vs. strain-rate γ̇(t).
It was demonstrated that by the Lissajous figure, τ(t) vs. γ̇(t), it is possible to distinguish between linear and branched polymers. In fact, secondary loops can only be attributed to polymers characterized by a completely linear macrostructure (could be due to polymer linearity irrespective of average molecular weight and molecular weight distribution). Increasing level of LCB separates the loading part of the stress signal from the unloading part thus, increasing the loop surface and balancing the distortion.
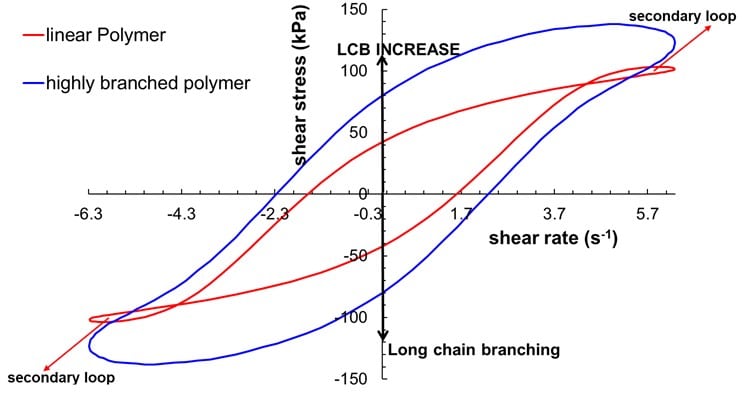
Figure 2. Lissajous-Bowditch figures: secondary loops indicate a linear macrostructure
The mathematical criteria used to determine the analytical condition associated with the onset of the secondary loops was originally proposed by Stadler and Burhin et al. (2008), see Figure 3. Ewoldt and McKinley derived an alternative criterion based on the following condition: G’M < 0. G’M is the minimum-strain modulus used as a measure of non-linear viscoelasticity, and a negative G’M value indicates that the material is unloading elastic contributions to the instantaneous stress faster than new deformation is being accumulated.
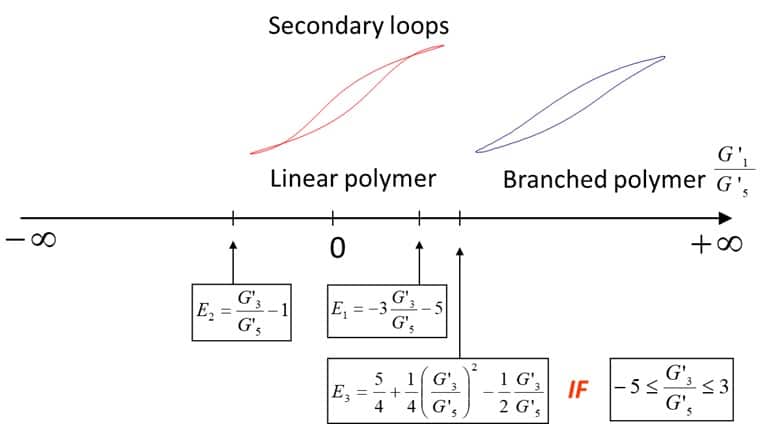
Figure 3. Criterion for the onset of secondary loops (Stadler and Burhin et al., 2008)
To quantify the level of LCB in the polymers we define a proper criterion and we introduced two LCB indexes: LCB 1 and LCB 2. The first one is the simple ratio between the first and the fifth harmonic component of Gʹ and following this criterion, the greater is this ratio the higher is the level of LCB in the polymer. The second LCB index comes from the theory that I have just shown you and it is mainly used to check the onset of these secondary loops. In fact, only polymers characterized by negative values of this LCB index show secondary loops.
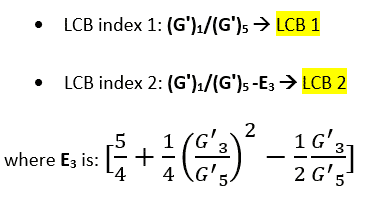
LCB 1 and LCB 2 indexes
This approach is purely empirical but compared to other rheological test methods it has the big advantage that it depends only on the degree of branching (LCB) and not on the other parameters of the macrostructure, polydispersity, MWD, and molecular weight, Mw, that is, both these indexes are insensitive to Mw and MWD.
Other rheologists for the characterization of LCB branched PE and PP grades have proposed two similar LCB indexes, see them below:
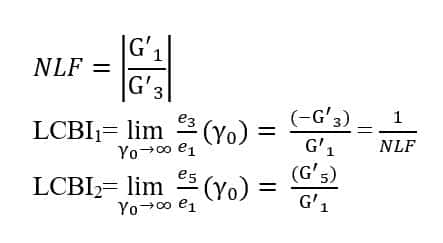
LCB indexes proposed for PE and PP grades
Part 4: Case studies on LCB and processability
See LAOS used to determine long chain branching and predict processability in real polymers.
- Roission N 2005 Master thesis. Université Catholique de Louvain (UCL), Faculty of Applied Sciences, Department of mathematical engineering (2004−2005)
- Ahirwal, D., M., Wilhelm, Filipe, S., et al; Journal of Rheology 58, 635 (2014)
- Hyun,K., Wilhelm, M., Ewoldt, R., McKinley, G.H., et al; Progress in Polymer Science 36 (2011) 1697–1753
- Pole, S., Isayev, A.;J Appl Polym Sci. 2021;138
- Burhin, H.; PMA 2009& 20th SRC 2009
- Ewoldt, R., McKinley, G.H.;Rheologica Acta · February 2010
- Ewoldt, R., McKinley, G.H.; J. Rheol. 52(6), 1427-1458