

Vulcanization must begin when required, accelerate when needed and stop at the right time. Variable Temperature Analysis (VTA) on the Premier RPA turns the RPA into a cure simulator for optimizing tire cure cycles.
- Optimum vulcanization depends on controlling temperature, pressure and time
- A tire has more than 10 components, and each must reach its optimum state of cure despite temperature gradients
- VTA feeds real thermocouple time-temperature profiles into the RPA to simulate the cure deep inside the tire
- Calculate % cure at events like the end of the high-pressure steam step and press open to optimize cycle time
What Vulcanization Does
The key chemical change in the compound occurs as sulfide bridges are created between adjacent rubber chains (Fig. 1). This crosslinking makes rubber non-sticky and improves its tensile strength. The material is no longer thermoplastic. The attractive physical properties of vulcanized rubber have revolutionized its application.
A typical vulcanization recipe includes a vulcanizing agent, an accelerator and an activator. Various combinations of these ingredients are employed to create a rubber compound that suits specific application demands. But more than just dumping a lot of stuff into a mixer and heating it up, the vulcanization process must be controlled. Simply stated, vulcanization must begin when required, accelerate when needed and must stop at the right time.
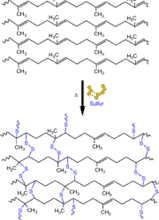
Figure 1. Sulfide bridges form between adjacent rubber chains
For optimum vulcanization, control three parameters
1
2
3
Getting Many Rubber Compounds to Act as One
A tire is a composite made up of more than 10 different components (Figure 2). The tire’s performance is a synergistic result of all the components. Thus, every component must be cured to its optimum level, because any deficiency in cure at any location can lead to premature failure of the tire. What’s more, as materials go, rubber is a generally poor heat conductor.
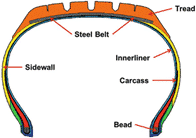
Figure 2. A tire’s components
When a thick rubber product like a tire is vulcanized in a defined mold there is a temperature gradient at the surface as well as the center of the product. The state of cure of the rubber compound is different at different locations. For example, the rubber compound that is in contact with the mold surface is slow curing, while the rubber compound in the center needs to be formulated for faster cure, to obtain the desired balance of cross linking in order to have the optimum rubber product performance.
For the tire to have a “balanced cure” all the components must reach a satisfactory state of cure by the end of the residence molding cure time (while still under pressure). And, even though a rubber compound may be sufficiently cured on demolding, it still requires a further post curing period to bring the cured physical rubber compound properties to an optimal level – thereby completing the cure cycle – in order to assure good tire performance.
Variable Temperature Analysis (VTA)
Variable Temperature Analysis (VTA) – a test function available on Alpha’s Premier™ RPA – is an excellent tool to optimize the cure cycle of a tire. And, while there are many Rubber Process Analyzers in use at various tire plants around the world, they do not all utilize Alpha’s software subtest for VTA to simulate the time-temperature profile. Instead, product engineers test the tire with thermocouples inserted into the tread-base shoulder region of a tire (the slowest curing part of the tire because of thickness) to establish precise time-temperature profiles.
However, using the VTA subtest included with the Premier RPA software, the lab technician can easily study the effects of changes in rubber compounds on the VTA cure curve and what implications this might have on optimizing the factory press cure cycle times. The technician can input the actual time and temperature of a cure cycle and determine the percentage of cure of the rubber compound at different locations within a tire.
Define the profile
Thermocouple time-temperature data is fed into Alpha’s Online Manager software to define a test (Graph 1).
Run the VTA test
The VTA test is run and torque (S′) versus time data is obtained (Graph 2).
Calculate % cure
Calculate percentage cure at different events in the tire cure cycle, for example at the end of the High-Pressure Steam Step and at the Press Open time.
Optimize the cycle
Based on the percentage of cure, optimize the tire cure cycle for the state of cure needed to demold and complete the post curing period.
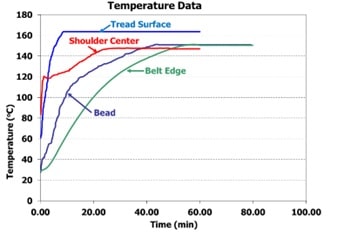
Graph 1. Time-temperature profile defined from thermocouple data
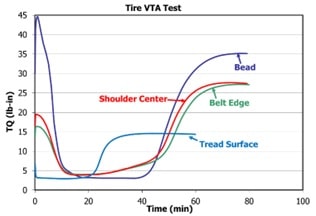
Graph 2. VTA torque (S′) versus time
The RPA becomes a cure simulator
Cure cycle optimization not only helps assure the performance of the tire, but also improves the productivity of the manufacturing process. By running the RPA VTA as a subtest programmed with time-temperature profiles, the RPA effectively becomes a “cure simulator” showing what the cure curve may look like, representing what is happening deep within the tire interior.
Optimize your cure cycles
Talk to our applications team about VTA testing on the Premier RPA.